Dashboard
The Kertos dashboard serves as the cockpit for Data Protection Officers and all supporting Kertos users. It is intended to work as the central touchpoint for keeping an overview of all Data Subject Requests and their respective timeframes. With a range of different filters and other dashboard elements, the workload can be visualized and scheduled ahead of time. The dashboard elements are designed to work intuitively and to replicate the workflow as it is implemented in the Kertos application.
KPI Filter
The first view that appears after clicking on the "Dashboard" tab on the left side of the application shows the requests filtered by the KPI filter on top.
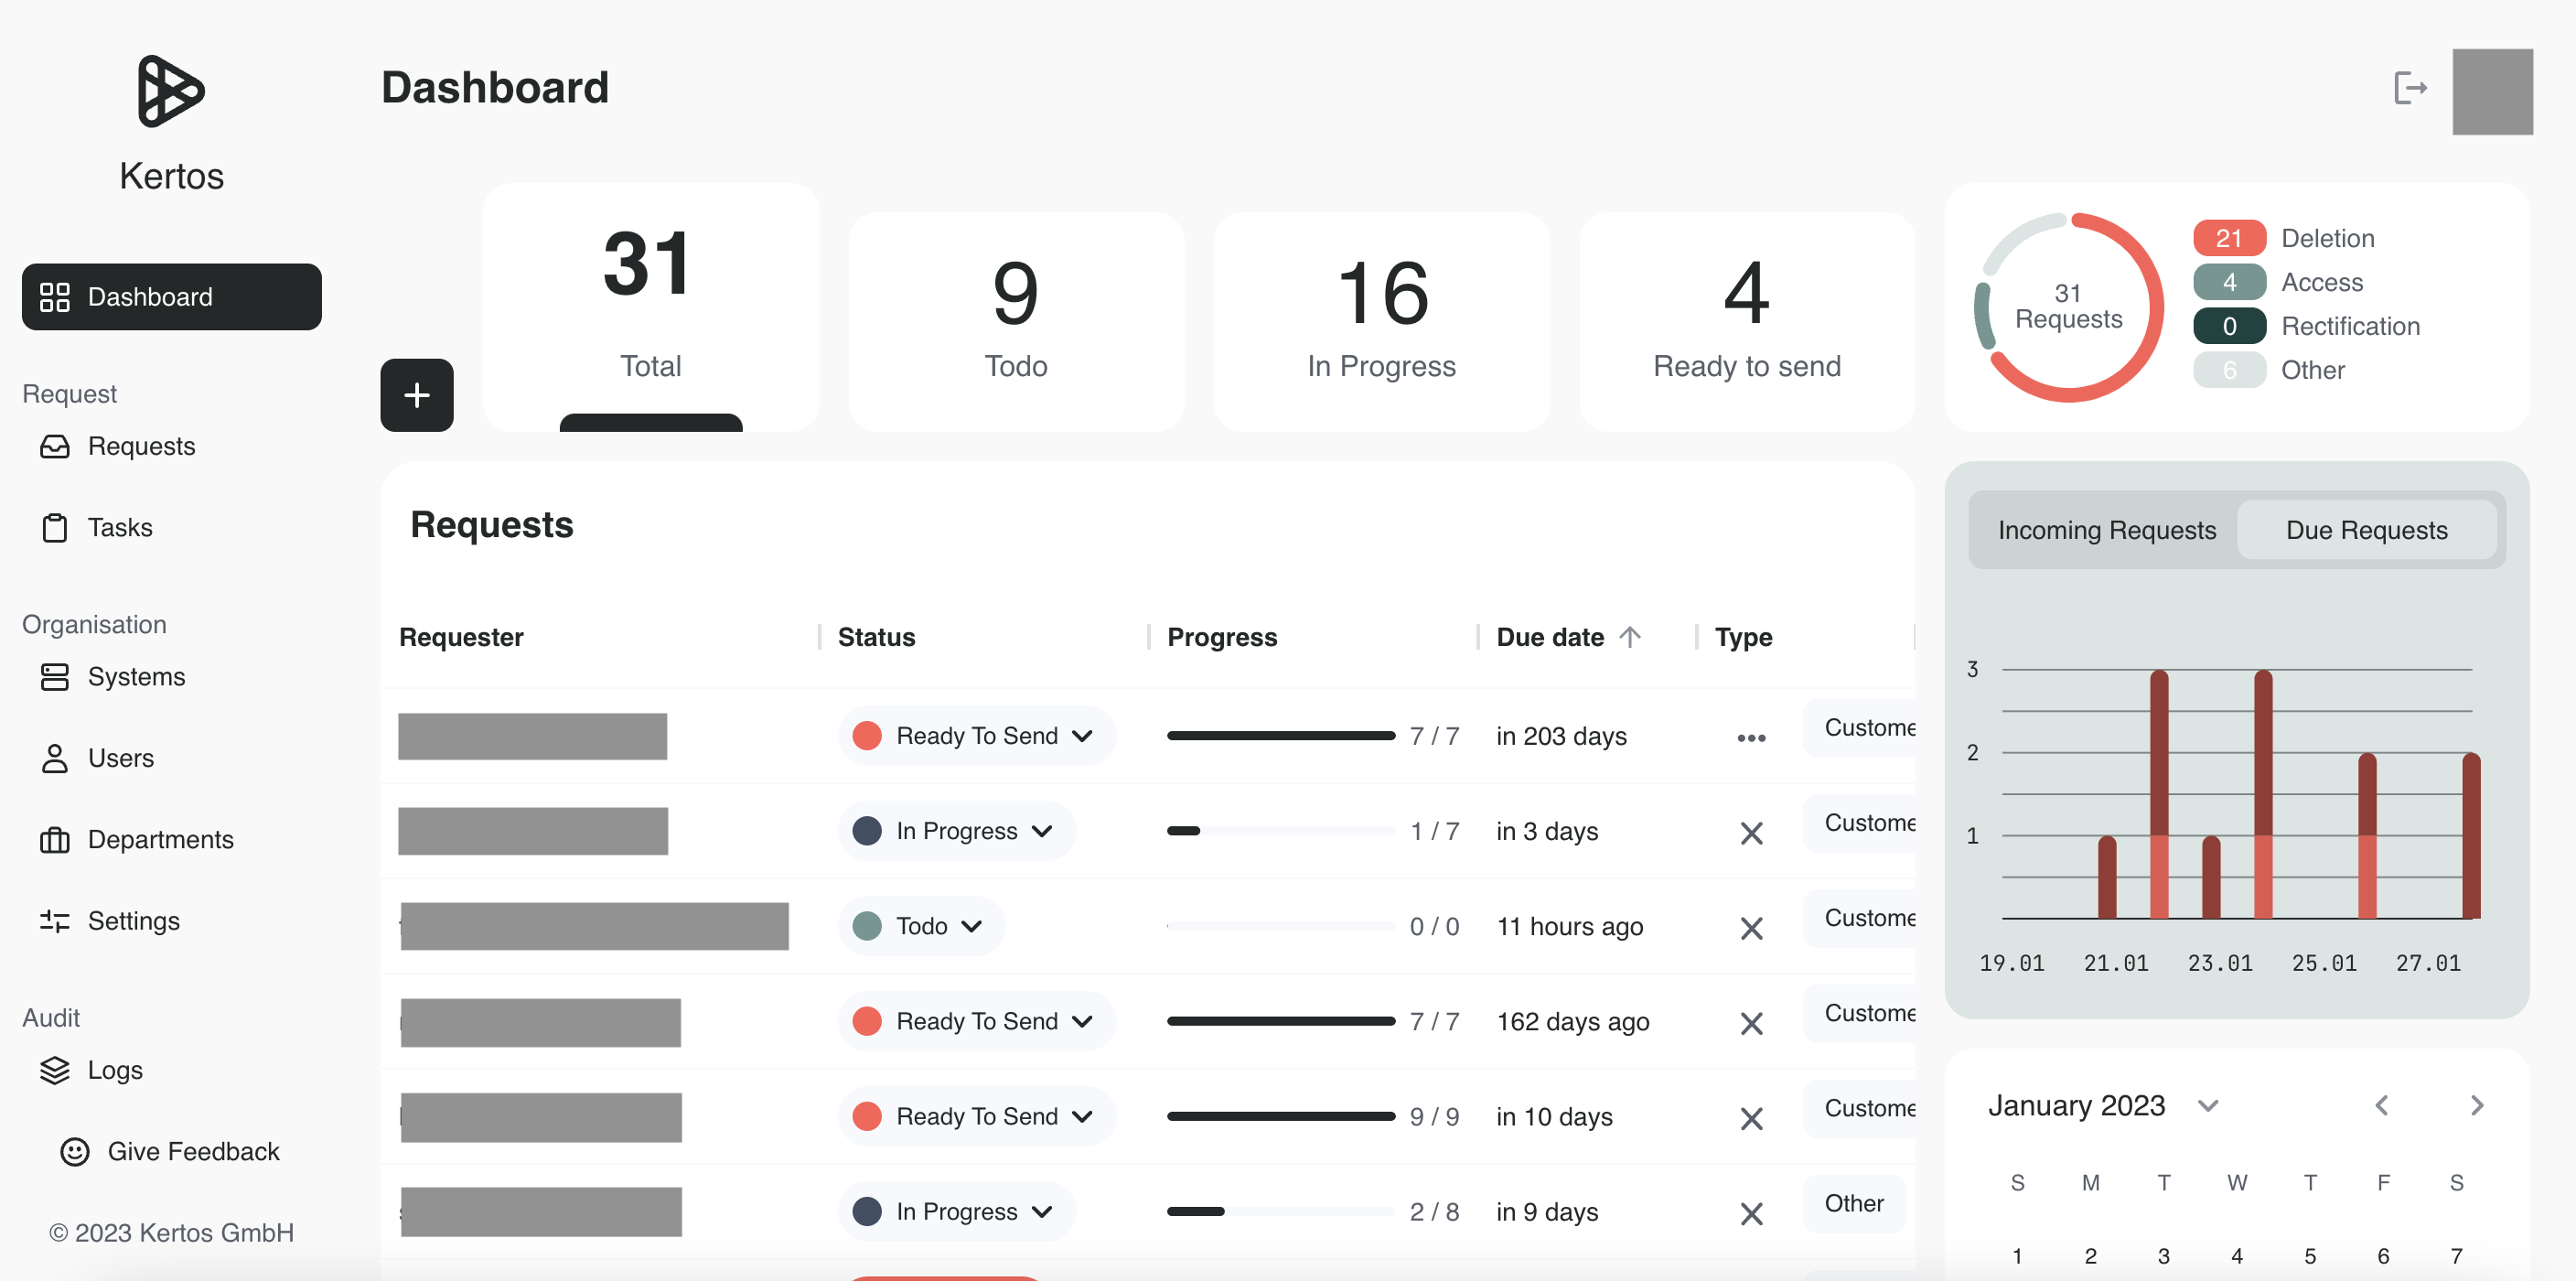
By clicking on the individual KPIs, the requests are filtered to only display those requests that are in the respective status like "Todo" or "Ready to Send". The arrangement of the KPI filters follows the status flow in the application. It starts with an overview of all requests, which is displayed when the "Total" KPI filter is activated. Afterward, the requests change their status following the other filters from left to right. They start in "Todo", move to "In Progress" (as soon as at least one System Task is in progress), and end in "Ready to send".
Please refer to the Kertos Concepts section to see details on the flow within the Kertos platform!
Heatmap Calendar
On the bottom right of the dashboard view is the Heatmap Calendar filter to keep track of due requests on specific days.
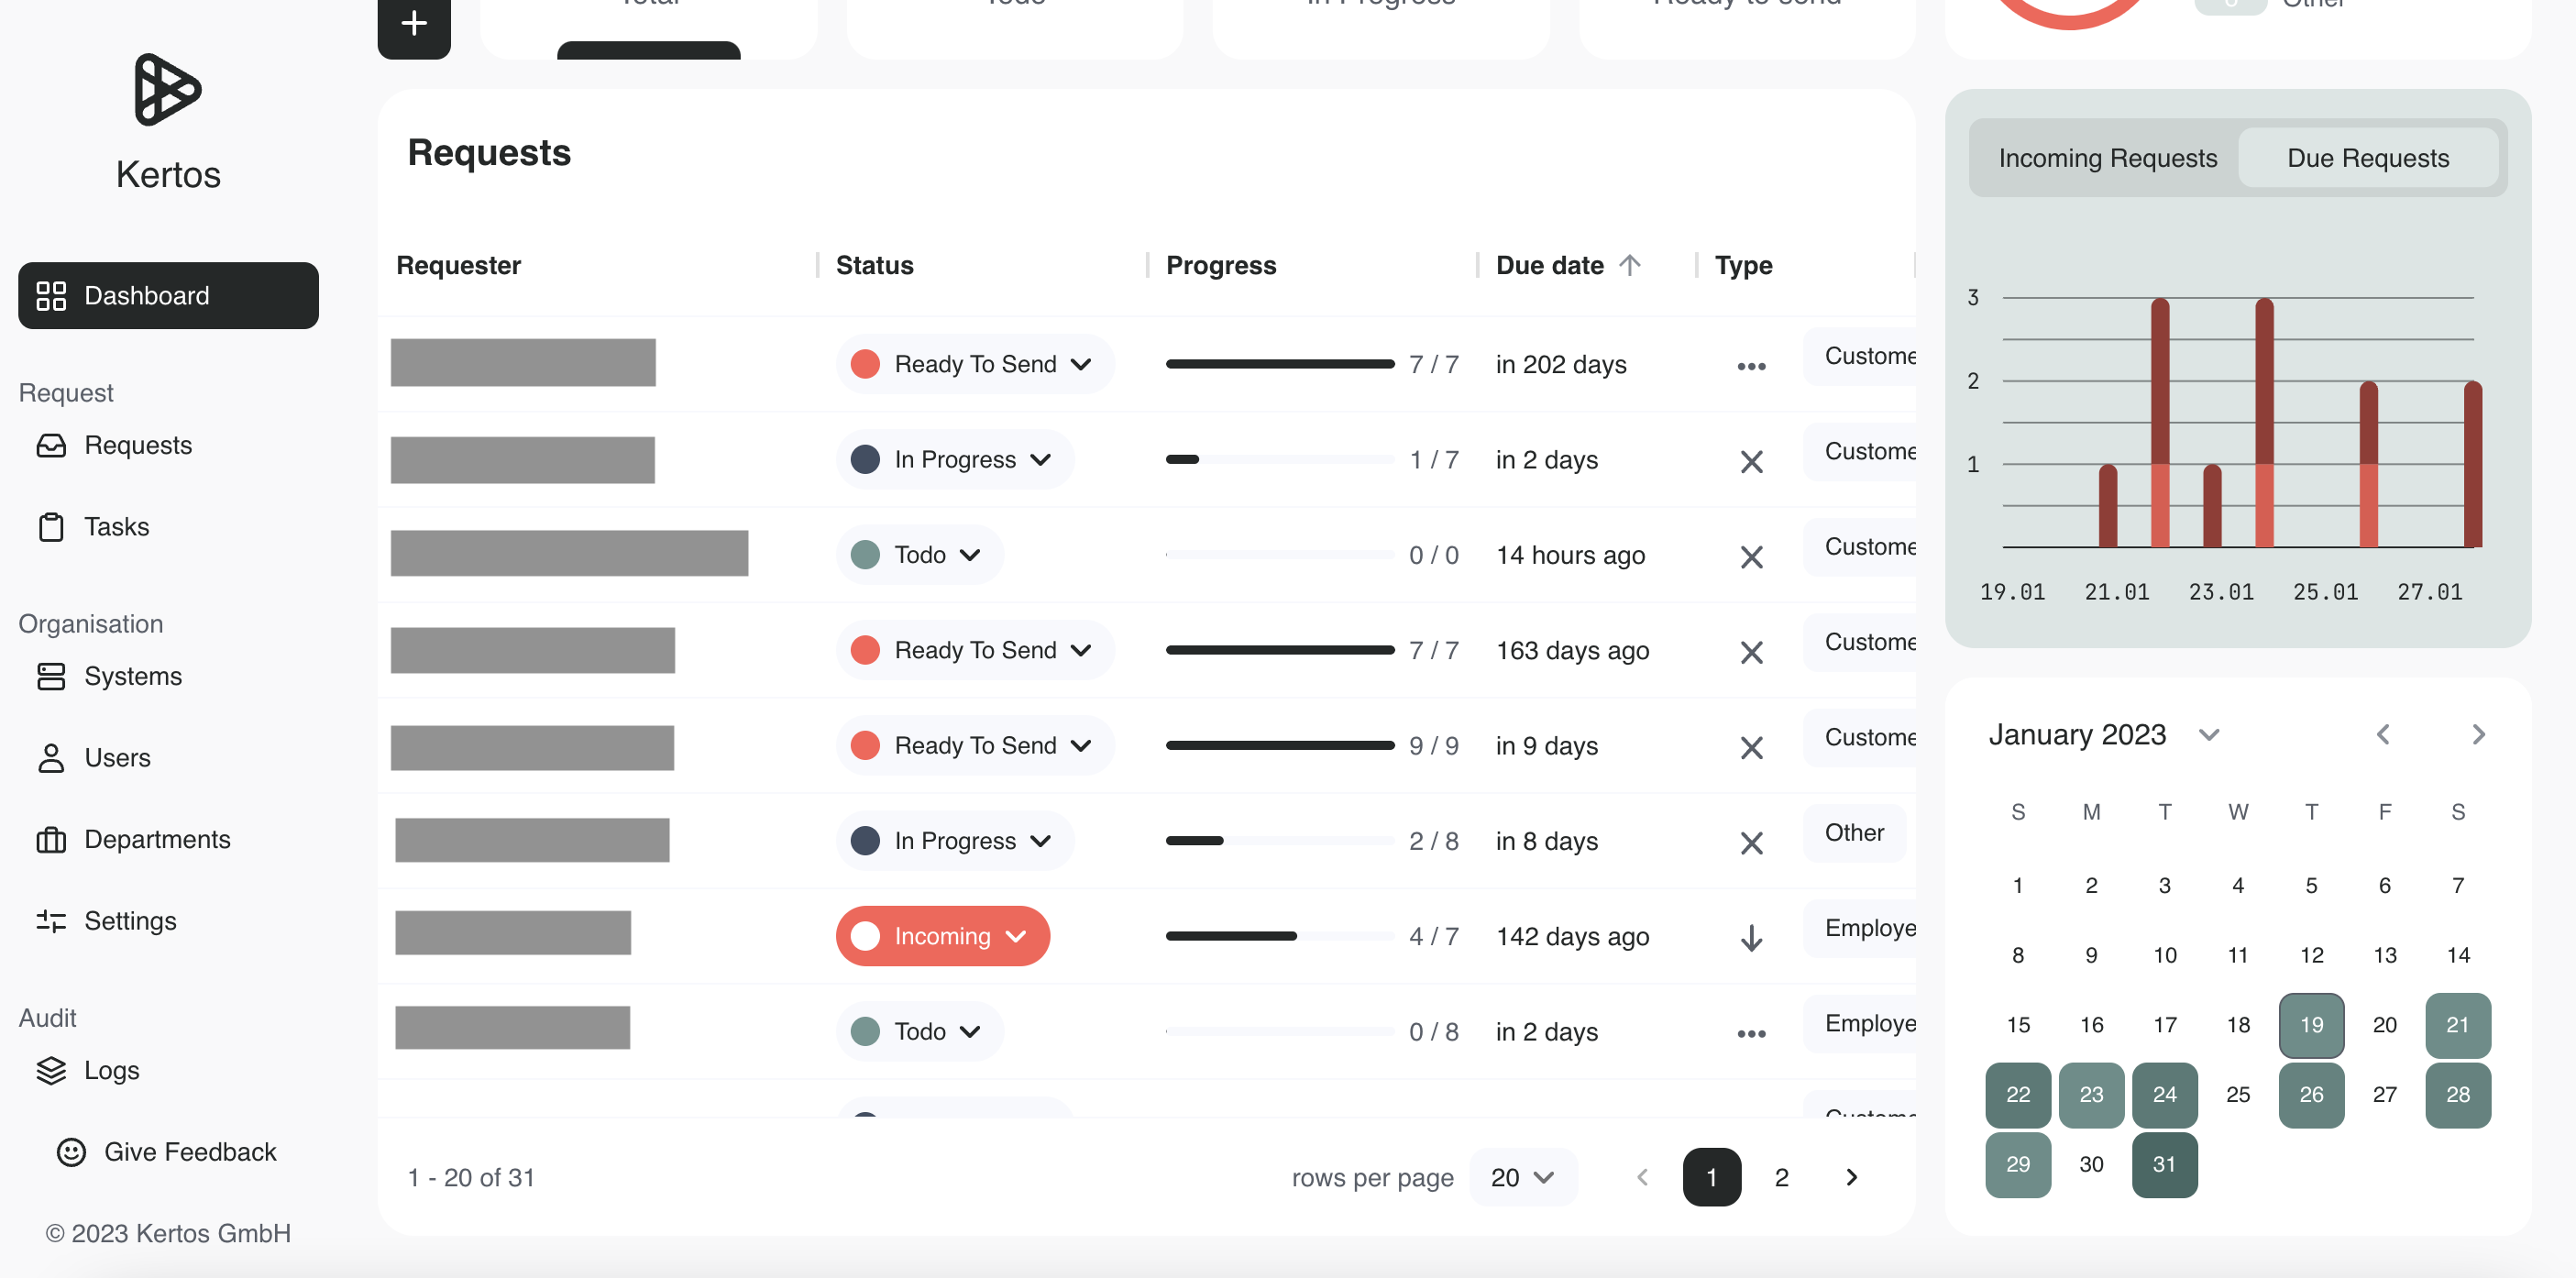
Clicking on the individual dates will filter the requests to only contain those due on that specific date. Note that, the KPI filters will be deactivated when the calendar heatmap filter is selected. To return to the regular KPI filters, just click on one of the KPIs to reset the filter and filter for the status. Additionally, just hovering over a date in the calendar shows how many requests are due. This is also indicated by a dark red color.
Requests Barchart
On the top right of the dashboard view, you can find the Request Barchart. This can be interactively used to see the workload on specific days.
In the Request Barchart, all requests are displayed as a diagram, broken down into individual days. Different colors indicate the different types of requests, for example "dark red" stands for a delete request. A slider at the top of the barchart can be used to switch between displaying incoming and due requests. By hovering over one of the bars you get additional information about the type of the requests. Clicking on one of the bars will display the selected request to your dashboard overview.